
Low Bond Prices have caused high Interest Rates, but that will BUST Inflation.
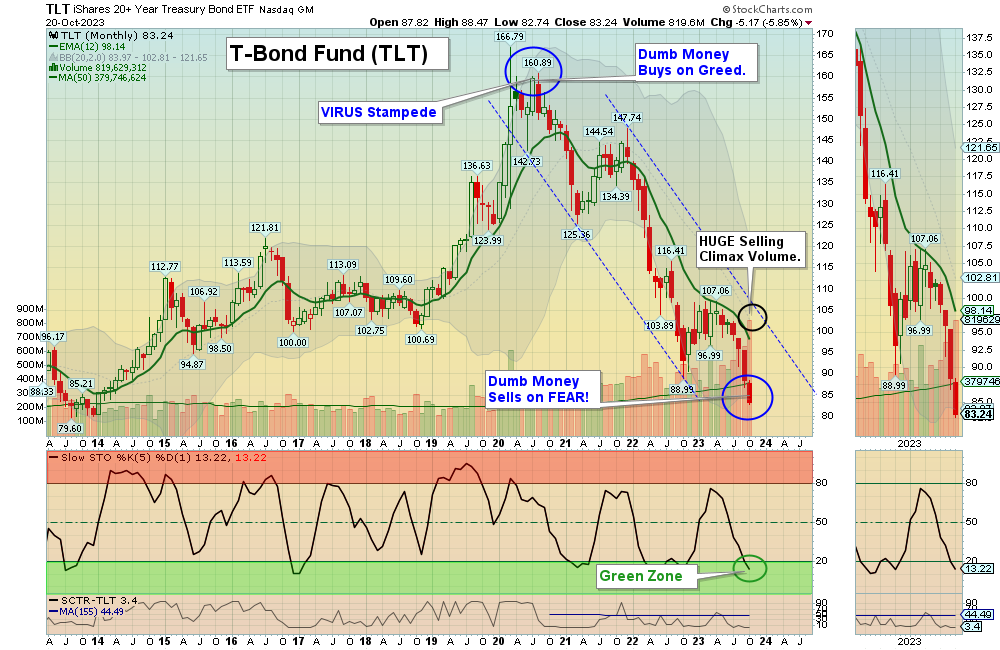
10/22/2023 Markets were lower for the week as long term Interest Rates shot up again and made a higher high on Inflation Fears. The Media is scaring Dumb Money into selling their Bonds now with a 5.1% yield (note huge Selling Climax Volume). This is the opposite of when Dumb Money was panic Buying Bonds in 2020 COVID with only a 1.12 % yield.
Eventually High Interest Rates will slow the Economy down, and the Green Line tells us that Rates should drop down to around 4%. Won’t investors be surprised! Now Stocks need for T-Bonds to put in a good bottom and bounce up. Eventually Bonds will meet again with the Green Line, when the Inflation FEAR subsides. Then we should see the Stock Indices go up on Wave 5 to retest the August high.
If you continue to Follow the Green Line System, your Money should flow into the Strongest areas and your account value should be able to grow in both Bull and Bear Markets. Follow the MONEY, not the MEDIA.
_____________________________________________________________________________________________
Small Gains were closed out this week on Lilly (+9.6%), Amazon, NVIDIA, NASDAQ 100 Fund, S&P 500 Fund & Tech Fund. The Grayscale BitCoin Fund GBTC broke out this week for Stage 2 Bull in the long Term Portfolio and shot up 16.8%.
_____________________________________________________________________________________________
For the week the Dow was down 1.58%, the S&P 500 was down 2.39% and the NASDAQ 100 was down 2.92%. Many of the major Indices still have a Relative Strength below 80, so you should currently own the stronger Funds here.
The Inflation Index (CRB) was up 0.72% for the week and is Above the Green Line, indicating Economic Expansion.
Bonds were down 4.99% for the week, and are Below the Green Line, indicating Economic Expansion.
The US DOLLAR was down 0.42% for the week and is Above the Green Line.
Crude Oil was up 0.44% for the week at $88.08 and GOLD was up 2.72% at $1994.40.
SEE SUPPLEMENTAL CHARTS
_____________________________________________________________________________________
We are doing many micro Day Trades on our new Discord site (free). Please join Discord on your cell phone app for day trading mobile notifications during the day. Other methods of notification have been too slow. Also, please check our our Live Streaming on YouTube during Market hours.
More action this week on the Day Trading Scrolling Charts, and Day Trading Charts for Indices & Large Caps.
_____________________________________________________________________________________________
MONEY BUYS SOON:
We are in now in 6 logged Swing Trading Positions for the Short & Medium Term. There are 8 investments on the Short Term Watch List.
Be patient and WAIT for Green Zone Buy Signals!
LONG TERM INVESTMENTS:
Long Term Scrolling Charts (Real Time)
AI C3 AI INC. Buy above $30.08 with High Volume with a 3% Trailing Sell Stop Loss below it.
BLDR BUILDERS FIRSTSOURCE Wait for next Weekly Money Wave Close > 20 with High Volume.
GBTC GRAYSCALE BITCOIN FUND Bought above $21.10 with High Volume and it shot up 16.8%.
ITB HOME BUILDING FUND Wait for next Weekly Money Wave Close > 20 with High Volume.
ORCL ORACLE CORP. Wait for next Weekly Money Wave Close > 20 with High Volume.
PINS PINTEREST INC. Buy above $30.86 with High Volume with a 3% Trailing Sell Stop Loss below it.
SH INVERSE S&P 500 FUND Buy above $17.71 with High Volume with a 3% Trailing Sell Stop Loss below it.
SVIX INVERSE VIX FUND (Greed Index) Wait for next Weekly Money Wave Close > 20 with High Volume.
TAL TAL EDUCATION GROUP Buy above $10.45 with High Volume with a 3% Trailing Sell Stop Loss below it.
WW WEIGHT WATCHERS INT’l. Buy above $12.13 with High Volume with a 3% Trailing Sell Stop Loss below it.
__________________________________________________________________________________________
My Trading Dashboard
Swing Trading Scrolling Charts
Day Trading Scrolling Charts
Click for Watch Lists
Click for Current Positions
Click for Closed Positions
Updated Top 100 List Oct 1, 2023
Dividend Growth Portfolio
Updated ETF Sector Rotation System
Dogs of the DOW System
Long Term Strategy for IRAs & 401k Plans
CNN Fear & Greed Index
Scrolling Stage Chart Investing Charts
Alert! Market Risk is Low (GREEN). The probability of successful Short Term Trades is better, when the % of stocks above the 50-day avg. is below 20.
Tell your Friends about the Green Line, and Help Animals.
________________________________________________________________________________
QUESTION: Juanita writes “Does the ATGL website list previously posted (or all) “recent comments,” not just the two to three most current ones? I find reading those comments and replies very helpful, but I frequently miss them because I am not on the computer trading every day. Is there somewhere on the website I can find older postings to review?”
ANSWER: Yes Juanita, all emails are available on the Main Menu of the web site under Commentary for weekly, and Buy/Sell Signals for Daily.
Good trading and tell your friends!